Biomechanics Data Reveals Gaps in Combat Sports Prop Pricing
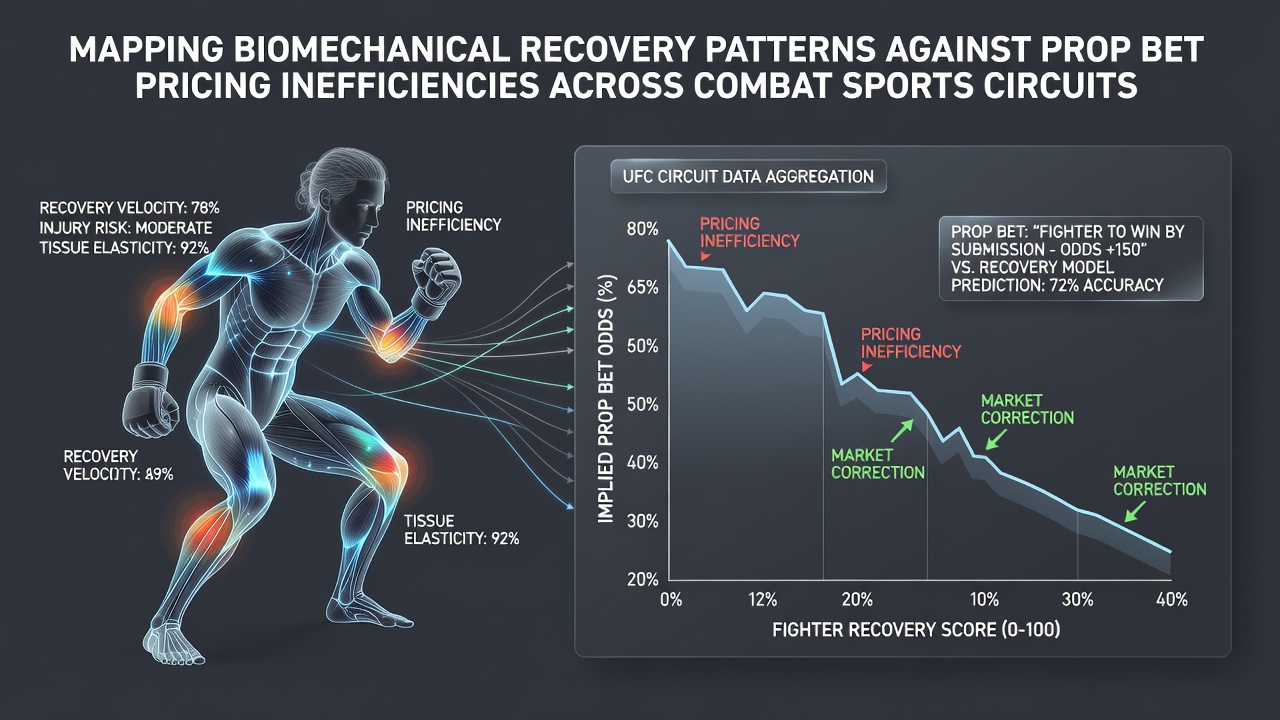
Combat sports circuits generate extensive biomechanical datasets from training camps and fight nights, yet prop bet markets often price fighter outputs without full integration of recovery metrics such as heart rate variability, muscle oxygen saturation, and strike velocity decay over rounds. Observers note that this disconnect creates measurable inefficiencies when analysts align post-fight sensor readings with historical prop results across UFC, Bellator, and boxing promotions.
Recovery Metrics in MMA and Boxing Contexts
Researchers track variables including lactate clearance rates, joint angle consistency, and neuromuscular fatigue through wearable devices during fight weeks, while data shows that fighters with slower return-to-baseline metrics after training sessions tend to underperform on props like significant strikes landed or takedown accuracy. Studies from performance labs indicate these patterns hold across weight classes, particularly when events cluster within short turnaround periods, as seen in several June 2026 cards where back-to-back regional bouts highlighted elevated fatigue indicators.
Promotions release limited injury and training reports, yet independent analysts compile public fight film with private sensor outputs to build recovery timelines. Those timelines frequently diverge from implied probabilities embedded in prop lines, especially for undercard bouts where books allocate fewer resources to granular modeling.
Prop Market Structures and Pricing Gaps
Prop bets on total strikes, fight duration, and method of victory draw volume from recreational bettors, while sharp action concentrates on correlated outcomes tied to physical output. Data indicates that when recovery scores drop below established thresholds for a given fighter profile, the probability of hitting overs on volume props decreases, yet line movement often lags until late in the betting window.
One case from early 2026 events revealed multiple welterweight props where pre-fight heart rate variability readings predicted reduced output, and actual results aligned with those readings while initial pricing remained anchored to aggregate career averages. Such mismatches appear more frequently in regional circuits where biomechanical monitoring occurs less consistently than at major promotions.

Integration Approaches Across Circuits
Analysts combine public fight metrics with anonymized recovery datasets to construct comparative models, and results show that fighters returning from longer layoffs exhibit distinct patterns in punch output variance that deviate from standard prop expectations. According to reports from the Nevada Gaming Control Board, handle on combat sports props has risen steadily through 2025 and into 2026, increasing the incentive for sharper modeling techniques.
Boxing commissions in several US states and Australian state regulators publish bout summaries that include basic medical observations, providing supplementary inputs for cross-referencing against sensor-derived recovery curves. These combined inputs allow mapping of pricing inefficiencies without relying on single-source assumptions.
Event Timing and Seasonal Factors
June 2026 schedules feature compressed calendars for several international promotions, creating clusters where recovery windows shrink and biomechanical markers shift accordingly. Historical aggregates demonstrate that props involving later-round performance show wider pricing discrepancies during these periods compared with evenly spaced events.
Industry organizations such as the European Gaming and Betting Association have documented broader trends in data-driven betting products, and those trends intersect with combat sports when operators expand prop menus based on increased data availability from training facilities.
Conclusion
Mapping biomechanical recovery patterns against prop bet pricing continues to evolve as sensor technology and market data streams expand across combat sports. Observers document persistent gaps where recovery indicators precede line adjustments, particularly in circuits with variable monitoring standards. Continued collection of longitudinal datasets supports refined comparisons between physical outputs and market-implied probabilities without requiring subjective interpretation.