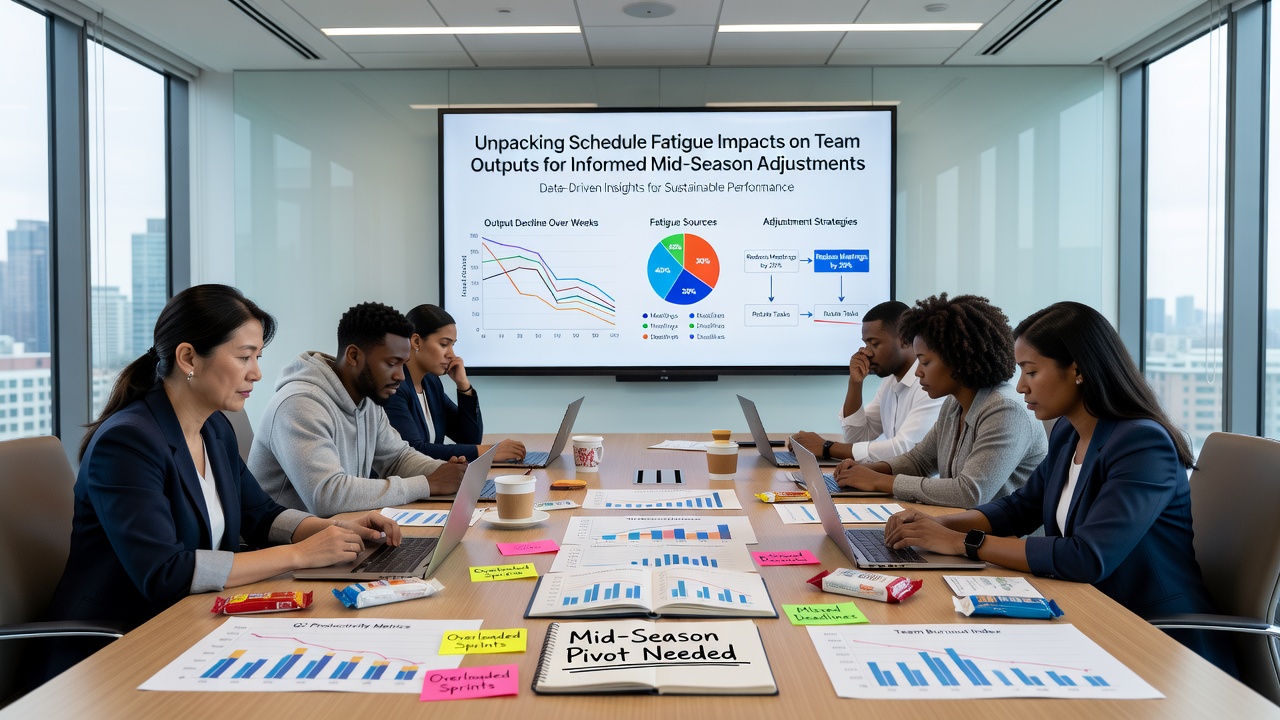
Breaking Down Schedule Fatigue Effects on Team Productivity for Strategic Mid-Season Shifts
Schedule fatigue emerges when teams face dense game calendars that limit recovery time between contests, and researchers have documented measurable drops in output metrics such as points per game, shooting percentages, and defensive efficiency ratings. Data from professional leagues shows these patterns intensify during winter months when travel demands compound with consecutive high-intensity matchups, and analysts track cumulative rest differentials to forecast performance variances.
Defining Schedule Fatigue Through Performance Metrics
Teams compile records that reflect both talent and accumulated physical load, yet fatigue registers clearest when back-to-back games occur within 24 hours or when cross-country travel follows late-night contests. Studies compiled by sports science departments at institutions like the University of Waterloo indicate that sleep disruption and muscle recovery timelines extend beyond 48 hours after such sequences, while box-score aggregates reveal declines in rebounding and assist-to-turnover ratios during the second half of extended road trips. Observers note these trends persist across basketball, hockey, and soccer calendars where fixture congestion peaks in February and March.
League Data Patterns Emerging in 2026
During the 2025-2026 NBA regular season, teams averaging fewer than one day of rest between games posted winning percentages approximately 8 percent lower than squads with at least two recovery days, according to league tracking reports. Similar patterns appeared in European soccer competitions where midweek Champions League fixtures overlapped domestic league obligations, and analysts recorded elevated injury incidence rates in the 72-hour window following such overlaps. June 2026 playoff schedules have already incorporated additional rest mandates for conference finals participants following regular-season data reviews, and these adjustments aim to stabilize output consistency through the postseason.
Travel and Recovery Variables
Longitudinal tracking by the Australian Institute of Sport highlights how time-zone shifts exceeding three hours correlate with reduced sprint distances and lower high-intensity effort percentages in the first 24 hours after arrival. Teams that implement structured sleep protocols and adjusted training loads during these windows maintain closer alignment with baseline output numbers, whereas squads relying on standard preparation routines show steeper second-half declines. Performance databases now integrate these variables into predictive models that inform betting markets on totals and player props.
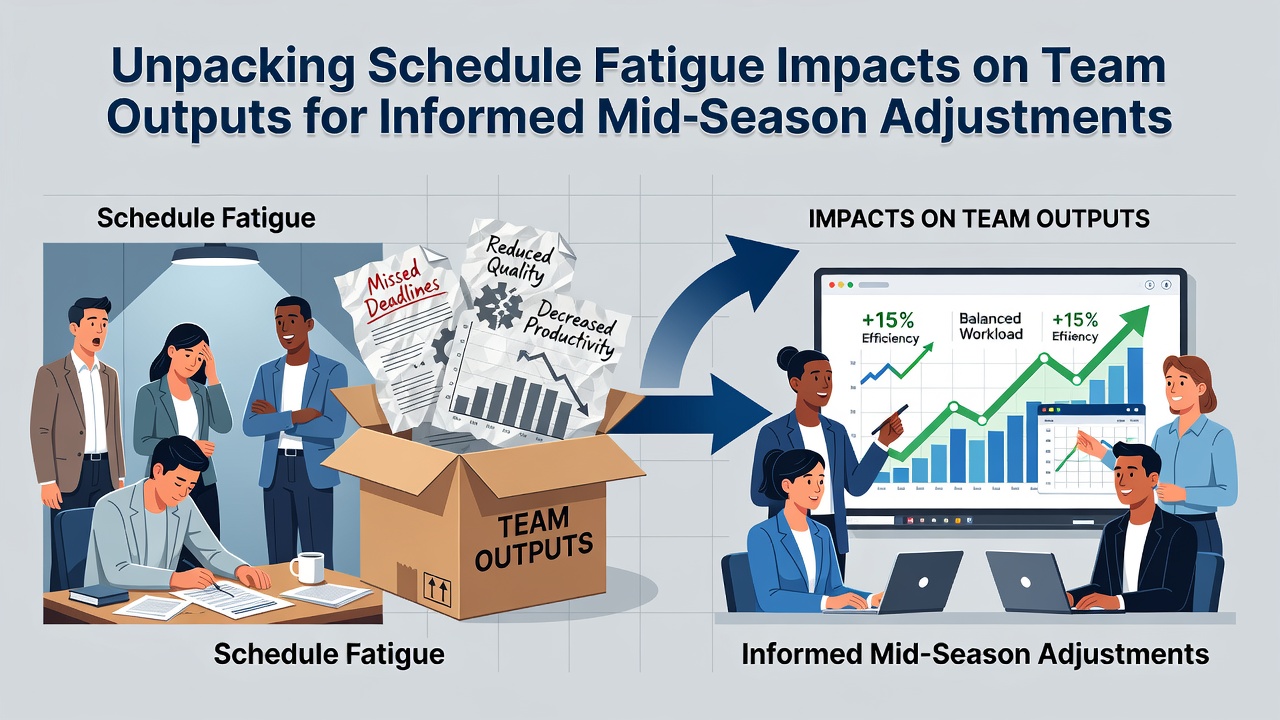
Mid-Season Adjustment Frameworks
Coaching staffs increasingly rely on load-management dashboards that aggregate minutes played, travel distance, and prior-day exertion scores to decide rotation adjustments. When cumulative fatigue indices exceed established thresholds, teams reduce starter minutes in non-conference matchups or deploy deeper benches to preserve key contributors for higher-stakes games. Research published in the Journal of Sports Sciences demonstrates that such targeted reductions preserve fourth-quarter output levels and lower soft-tissue injury occurrences by measurable margins.
Front-office personnel cross-reference these internal datasets with publicly available schedule strength rankings to project remaining-season trajectories. Organizations that recalibrate expectations around fatigue-adjusted projections achieve tighter alignment between anticipated and realized results, particularly in the second half of seasons when back-to-back clusters intensify.
Case Examples From Recent Seasons
One Eastern Conference squad in the 2024-2025 campaign altered its rotation after a seven-game stretch featuring four back-to-backs, shifting primary scoring responsibilities to bench units in the final two contests of that sequence. Output data showed the team's effective field-goal percentage stabilized rather than continuing its prior downward trajectory, and subsequent win rates improved once the schedule eased. Comparable adjustments occurred in NHL clubs navigating condensed January calendars, where line combinations rotated to distribute ice time more evenly across forward groups.
These tactical shifts illustrate how organizations convert fatigue analytics into actionable lineup decisions that sustain competitive outputs through demanding periods.
Conclusion
Schedule fatigue registers as a quantifiable factor that influences team outputs across multiple professional sports, and mid-season recalibrations grounded in rest differentials and workload metrics allow organizations to mitigate performance dips. Data aggregated through 2026 continues to refine these models, supporting more precise projections for remaining fixtures and strategic resource allocation.