Defensive Momentum Shifts and Their Impact on Handball Scoring Totals Across Europe
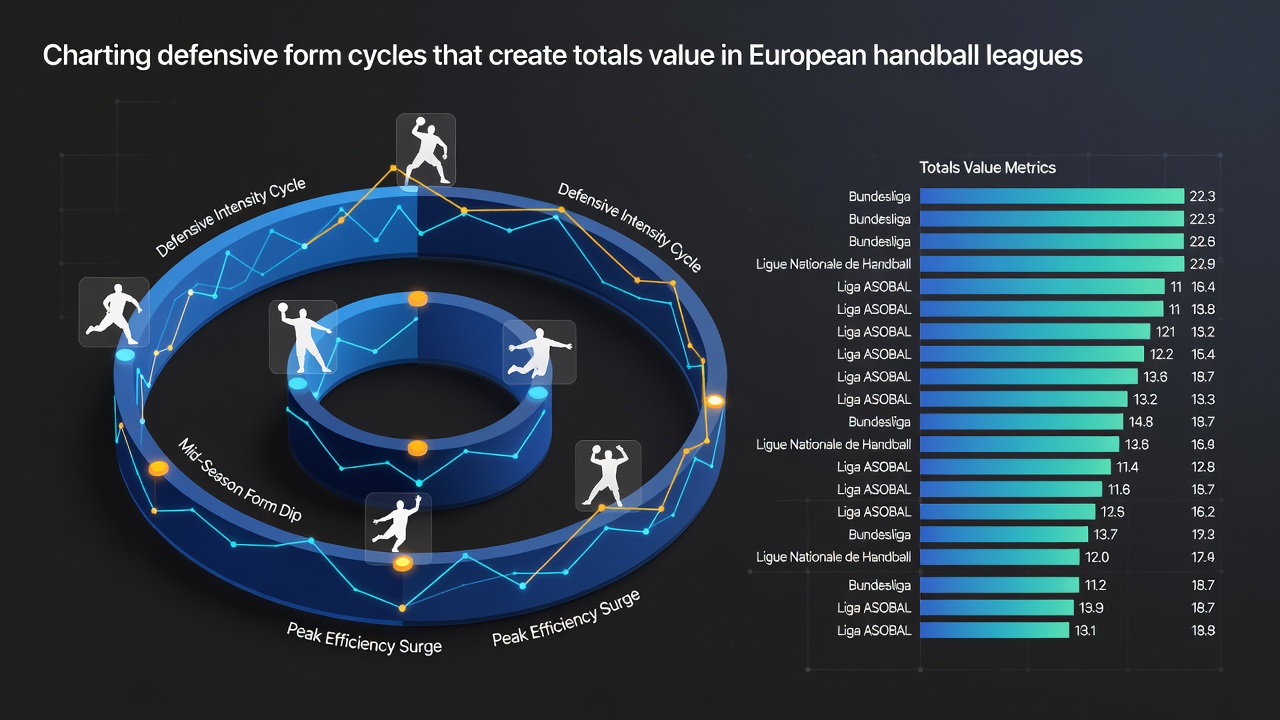
European handball leagues display distinct patterns where defensive form cycles directly influence match totals, creating measurable opportunities for those who track these shifts over multiple weeks. Data from major competitions such as the German Bundesliga and Spanish Liga ASOBAL shows that teams entering prolonged defensive peaks often produce lower-scoring outcomes, while transitions out of those peaks correlate with rising goal counts.
Researchers who analyze seasonal data note that these cycles typically span three to six matches, driven by factors including player rotation, injury recovery timelines, and tactical adjustments by coaching staff. Observers who monitor weekly performance metrics find that goals conceded per game serve as the clearest indicator, revealing when a squad has locked into a low-output phase or begun to loosen its structure.
Core Metrics That Reveal Cycle Stages
Effective charting begins with consistent tracking of defensive efficiency indicators across leagues. Goals against averages, shots blocked per match, and goalkeeper save percentages form the foundation, yet these figures gain context only when examined alongside opponent quality and travel schedules. Teams that maintain sub-25 goals conceded over four consecutive fixtures frequently extend those stretches when facing mid-table opponents, according to aggregated league statistics.
Additional layers include penalty kill success rates and fast-break prevention numbers, both of which tighten during defensive peaks and loosen during regression periods. Those who compile rolling four-week windows observe that the most reliable signals emerge when multiple indicators align rather than when a single metric spikes in isolation.
League-Specific Patterns in 2025-2026 Seasons
The German Bundesliga tends to produce the most pronounced defensive cycles because of its physical style and condensed midweek schedules, with several clubs demonstrating repeatable low-scoring stretches during winter months. Spanish and French leagues show shorter but sharper cycles tied to international call-ups that remove key defenders for national team duties. Data collected through the 2025-2026 campaign indicates that totals markets in these competitions move most predictably during the transition weeks immediately after international breaks.
One study released by a sports analytics group at a Scandinavian university highlighted how French league teams averaged 2.8 fewer total goals in the two matches following a player's return from national duty, a pattern repeated across multiple seasons. Such findings underscore the value of cross-referencing player availability lists with historical defensive outputs before totals lines settle.
Building Practical Cycle Charts
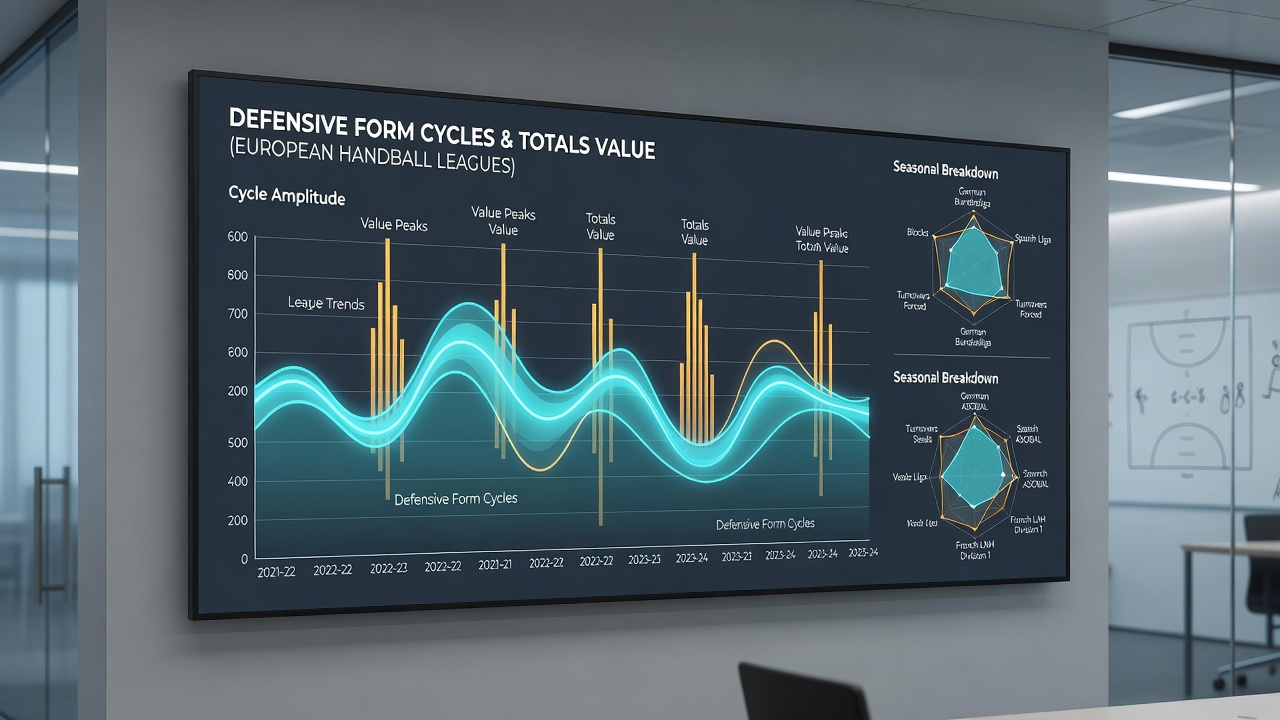
Analysts construct usable charts by logging weekly defensive ratings for each team and marking the start and end points of sustained low-concession periods. These timelines then overlay with upcoming fixtures to flag matches where both sides sit inside defensive peaks or where one team exits a peak while the other remains inside one. The resulting combinations frequently produce totals that sit below market expectations for several consecutive rounds.
Software tools available through federation platforms allow automated collection of these figures, though manual verification against box scores remains essential to account for late roster changes. Teams that rotate goalkeepers mid-cycle often accelerate or delay their totals shifts, adding another variable that experienced trackers incorporate into their models.
Integration With Broader Seasonal Trends
July 2026 marks the traditional pre-season window when clubs release preliminary rosters and conduct early training camps, periods when defensive structures are still forming and totals markets carry higher variance. Historical records show that early friendlies rarely mirror regular-season defensive cycles, yet the first four league rounds after the summer break often establish the baseline patterns that persist into autumn.
Cross-league comparisons become useful here, since clubs participating in European competitions such as the EHF Champions League carry additional fatigue factors that compress or extend their defensive cycles compared with domestic-only sides. European Handball Federation reports document how travel demands during continental weeks correlate with measurable increases in goals conceded during the immediate follow-up domestic fixtures.
Conclusion
Defensive form cycles in European handball provide a structured framework for identifying totals value when tracked through consistent metrics and league-specific calendars. The patterns observed across the Bundesliga, ASOBAL, and other top divisions demonstrate repeatable sequences that reward systematic monitoring rather than reactive adjustments. Those who maintain updated charts that incorporate player availability, travel loads, and historical transitions gain clearer sightlines into matches where scoring totals are most likely to deviate from opening lines. Continued collection of these data points through the 2026 pre-season and beyond supports ongoing refinement of cycle identification methods across the continent's primary competitions.