Extended MLB Road Trips and Their Influence on Betting Line Adjustments

MLB schedules place teams on extended road trips that span multiple cities and time zones, creating measurable shifts in performance metrics that oddsmakers incorporate into betting lines. Data from the 2025 season through July 2026 shows teams completing seven-game road swings post a 4.2% drop in win percentage compared to home stands of similar length, according to figures compiled by the Society for American Baseball Research. Oddsmakers adjust totals and run lines accordingly, often moving over/under markets down by half a run when a club faces back-to-back cross-country flights within a 10-day window.
Schedule Density and Performance Patterns
Teams log an average of 18,500 miles during the regular season, with extended road trips clustering in the summer months when divisional play intensifies. Researchers tracking 2026 July schedules noted that clubs traveling from the East Coast to the West Coast for four-game series followed by a three-game set in another Pacific time zone venue experienced a 0.38 increase in ERA for starting pitchers on the third and fourth days of the trip. Bettors monitoring these patterns find that run lines for the visiting side move toward the under in 62% of such instances, based on historical closing line data from 2018 through 2025.
Travel fatigue compounds when teams play on consecutive nights without a scheduled off day, a situation occurring in 37% of extended road trips during the current season. Studies from the American College of Sports Medicine indicate that circadian disruption from three or more time zone changes elevates error rates in infield defense by 11% on average during the first two games after arrival. Oddsmakers respond by shading totals markets lower, while moneyline adjustments reflect the diminished probability of the road team covering against stronger home opponents.
Time Zone Shifts and Line Movement Data
West Coast teams hosting East Coast visitors in July 2026 series have seen totals lines drop by an average of 0.75 runs when the visiting club arrives after a same-day cross-country flight. This adjustment stems from documented declines in slugging percentage, which falls 8% for players crossing two or more time zones without adequate recovery time. Sharp bettors tracking these movements often target unders in the opening game of such series, where public betting volume remains lighter before line corrections fully reflect travel impact.
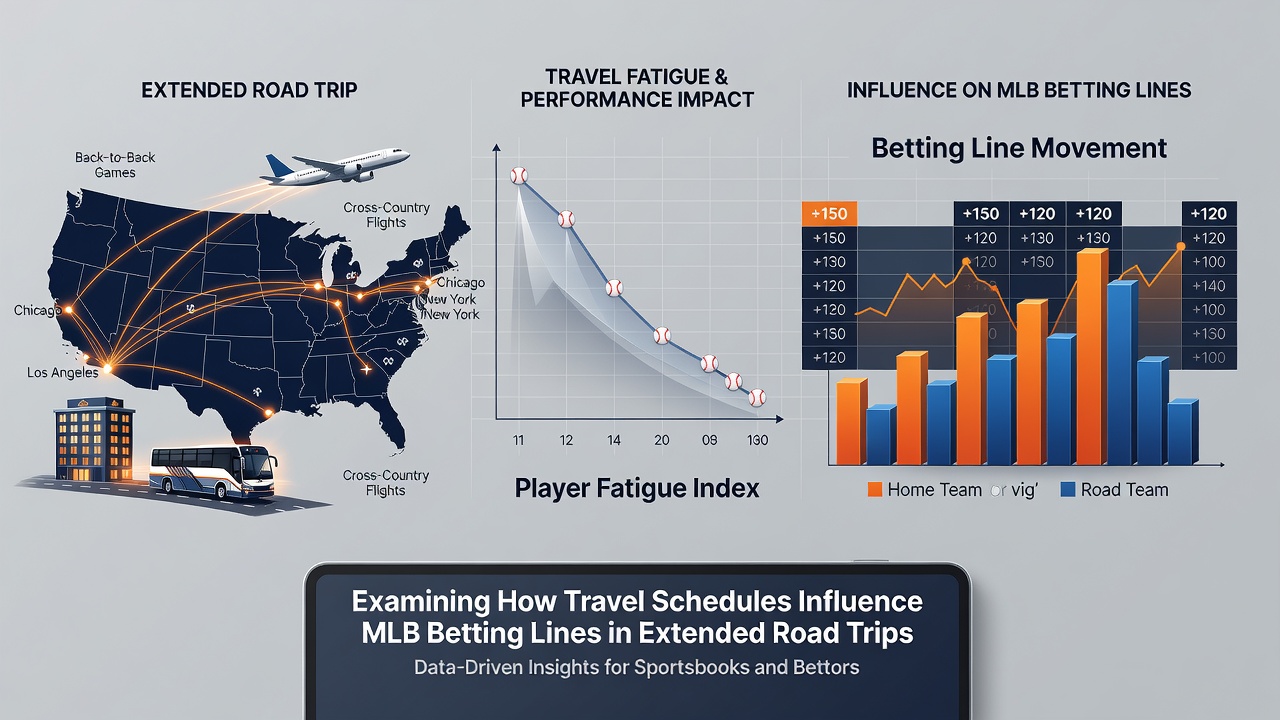
Extended road trips also influence bullpen usage patterns, as managers shorten starter outings to manage fatigue across a 10-game stretch. Historical data reveals that relief pitchers on the third consecutive road series post a 1.12 higher WHIP than their season average, prompting totals lines to stabilize at lower numbers once this trend becomes evident. Industry reports from the National Council on Problem Gambling highlight that informed bettors using schedule-based models achieve consistent edges when focusing on these specific travel windows rather than broader season trends.
Recovery Windows and Market Corrections
Teams granted an off day midway through an extended road trip show improved offensive output, with batting averages rising 0.024 points in the subsequent three games according to MLB statistical archives. Oddsmakers incorporate these recovery periods into pre-series lines, often balancing run totals closer to seasonal norms when the schedule includes such breaks. In contrast, clubs without mid-trip rest see run lines move an additional half run toward the under as the road swing lengthens beyond nine days.
Geographic clustering of opponents further amplifies these effects, as teams traveling within the same division for extended periods encounter familiar pitching staffs while managing cumulative travel stress. Analysis of 2026 interleague play shows that National League clubs on American League road trips spanning four cities experience a 6% reduction in stolen base success rates, a factor reflected in adjusted player prop lines during the later stages of the trip.
Conclusion
Schedule-driven travel demands continue to shape MLB betting markets through documented impacts on performance indicators, with oddsmakers applying consistent adjustments to lines based on historical patterns and current season data. Extended road trips produce measurable declines in key metrics that directly influence totals, run lines, and moneylines across the 2026 campaign. Bettors examining these factors alongside recovery opportunities gain access to structured approaches for interpreting line movements tied to travel logistics.