Goalie Rotation Strategies Expose Edges in NHL Totals Wagering
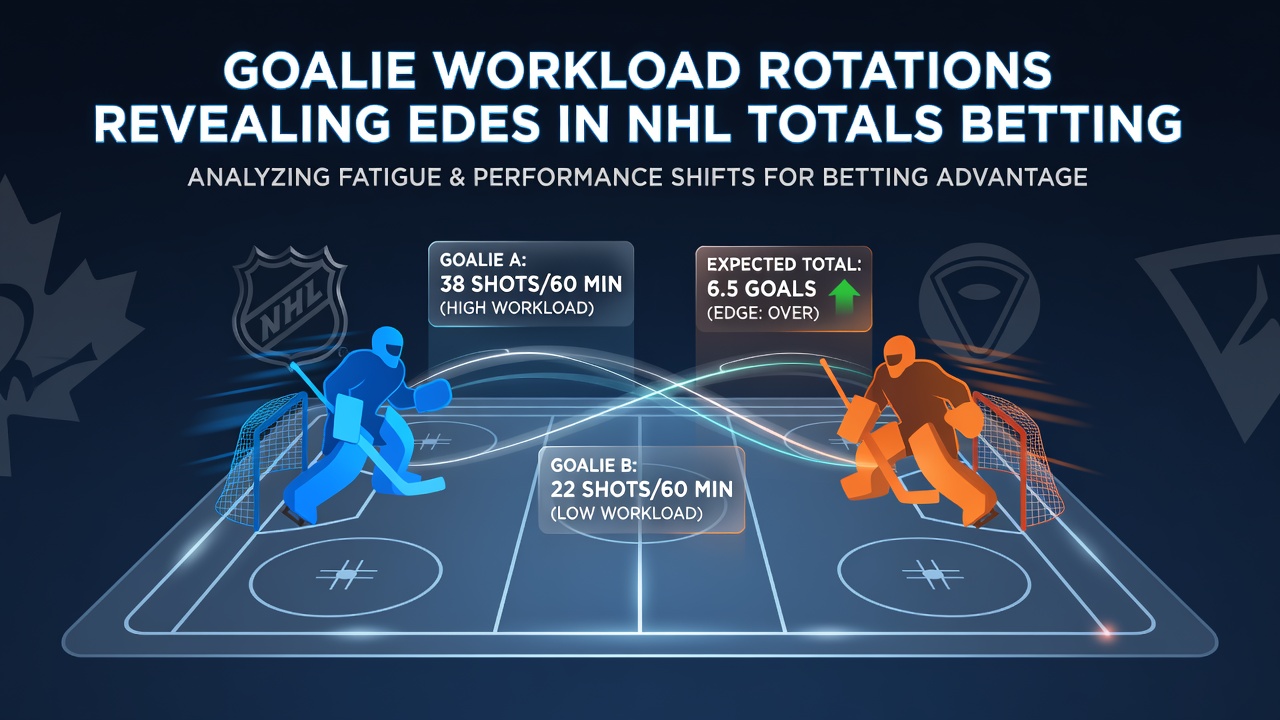
Goalie workload rotations have emerged as a key factor in NHL totals betting, where data on rest patterns and consecutive starts provide measurable edges for over and under wagers. Teams manage netminders through structured schedules that balance performance demands with recovery needs, and these decisions directly influence goal totals across games. Observers tracking these rotations note consistent correlations between fatigue indicators and scoring outputs, particularly in back-to-back situations or extended starts without rest.
Workload Metrics and Their Direct Effects
Teams track goalie starts across multiple games, including consecutive appearances and days between outings, while league data shows that goalies facing three or more starts in a five-day window allow elevated shot totals on average. This pattern holds because fatigue reduces reaction times and positioning efficiency, leading to more pucks reaching the net and ultimately more goals. Researchers analyzing 2024-2025 season figures found that rested goalies in optimal rotation cycles posted save percentages 2-3 points higher than those in heavy workloads, which translates into fewer total goals per contest.
And yet the impact extends beyond individual games. When clubs deploy backup goalies after a starter's heavy stretch, totals markets often shift as public bettors overlook the rotation details. Data indicates that under bets gain value in these scenarios because fresher netminders stabilize defensive structures and limit high-danger chances.
Seasonal Trends Through 2025-2026
During the 2025-2026 regular season, workload management intensified as clubs navigated compressed schedules and injury clusters. By June 2026, analysts had compiled season-long datasets revealing that teams employing strict rotation protocols saw their games average 0.4 fewer total goals than league norms. This edge appeared most pronounced in divisional matchups where familiar opponents exploited known fatigue patterns. Figures from the NHL's performance tracking systems confirm that goalies with at least two full rest days between starts allowed 28.4 shots per game on average, compared to 31.7 shots in shorter rest cycles.
Betting Applications in Totals Markets
Bettors who monitor daily lineup reports and goalie usage logs gain access to these edges before lines adjust. For instance, when a starter logs back-to-back games across travel-heavy stretches, totals lean toward the over as defensive lapses accumulate. Conversely, situations involving planned rest for a primary goalie create under opportunities because the incoming netminder often faces fewer quality scoring chances. Industry reports from sources like the Canadian Institute for Health Information highlight how workload data integrates with injury tracking to refine these projections across the league.
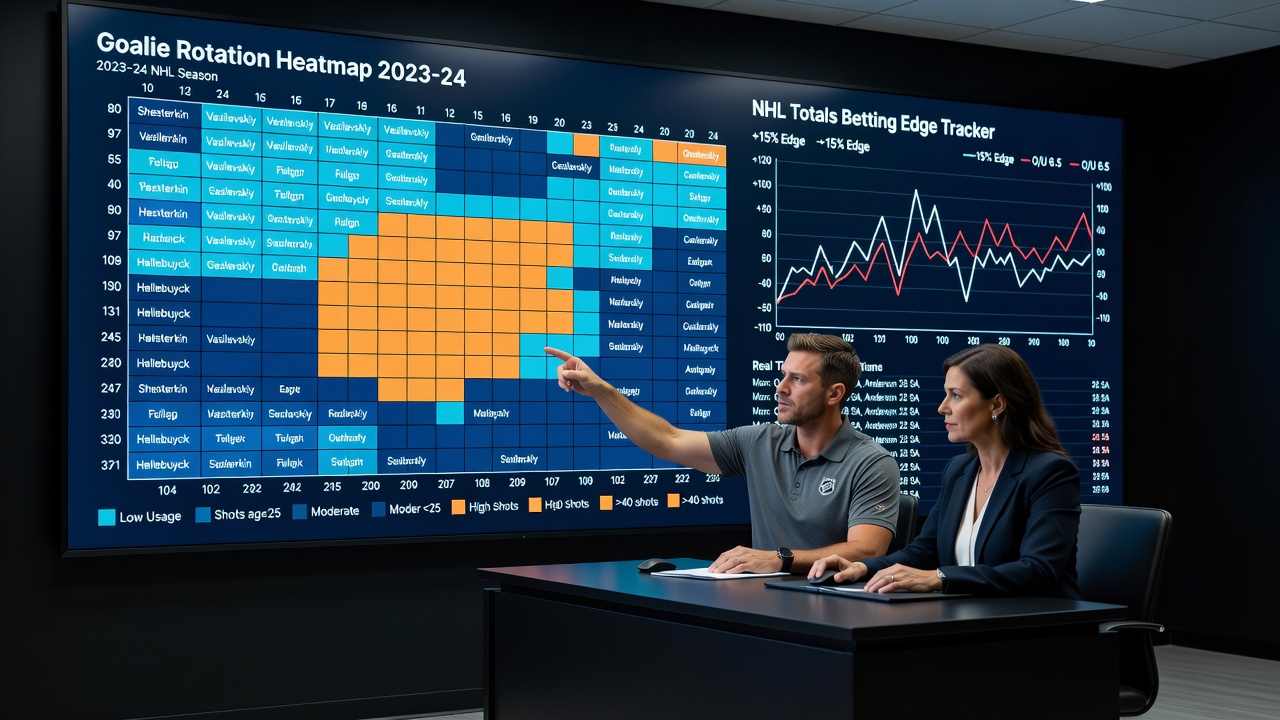
What's notable is how this information compounds in playoff windows, where rotations tighten and every start carries amplified stakes. Teams that preserved goalie freshness through the regular season demonstrate clearer advantages in totals outcomes during postseason series.
Practical Examples from Recent Play
Take one Eastern Conference club that rotated its tandem goalies evenly through a 10-game January stretch in 2026. Their games produced totals under the posted line in seven instances, aligning with pre-game workload projections that flagged the rested status of each starter. In contrast, a Western Conference squad that leaned on a single goalie for five consecutive games saw elevated goal outputs in four of those contests, creating over edges once the pattern surfaced in betting markets. These cases illustrate how rotation discipline influences scoring volume without relying on subjective assessments.
External factors such as travel distance and altitude also intersect with workload data, as goalies recovering from cross-country flights show measurable declines in performance metrics. League statistics compiled through June 2026 confirm that high-altitude venues compound fatigue effects, pushing totals higher when rested netminders are unavailable.
Conclusion
Goalie workload rotations continue to shape NHL totals betting by supplying objective data points that teams and bettors alike can track through official records. As schedules evolve and analytics platforms expand their coverage, these patterns remain central to identifying value in over and under markets. The integration of rest metrics with game outcomes provides a factual framework that persists across seasons and playoff structures alike.