How Point-by-Point Data Reveals Variance Patterns in Tennis Live Betting

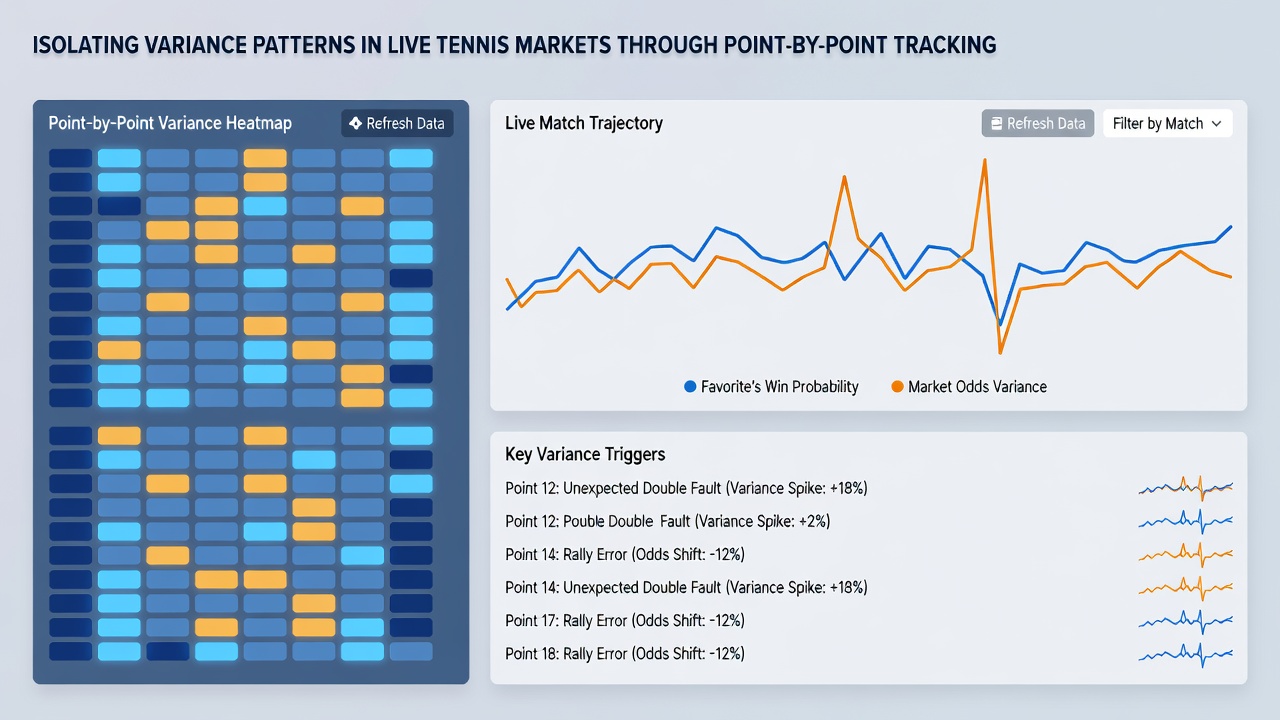
Live tennis markets shift rapidly because each point alters implied probabilities in real time, and point-by-point tracking isolates the variance components that drive those movements. Observers note that traditional set or game level data smooths over short-term fluctuations, whereas granular sequences expose serve win rates, break point conversion, and momentum clusters that betting exchanges price with increasing precision during matches.
Core Components of Point-Level Variance Isolation
Analysts break live tennis variance into distinct layers by logging every point outcome against pre-match baselines, and this method separates noise from signal when lines adjust after double faults or aces. Data streams capture rally length, return depth, and unforced error timing, allowing models to recalibrate expected game win percentages mid-set, while longer sentences connect these observations to market reactions across multiple exchanges operating in parallel time zones.
Researchers apply sequential filtering to remove the effects of known player tendencies before attributing remaining deviations to variance, and studies from academic sports analytics groups show that such filtering improves identification of temporary edges in under-three-minute windows following extended rallies. Those who track these sequences across Grand Slam events report that variance spikes cluster around tiebreak transitions and after medical timeouts, patterns that automated scripts flag faster than human traders alone can process.
Implementation Through Sequential Logging Tools
Software platforms ingest ball-tracking feeds and score increments simultaneously, producing timestamped records that feed directly into variance calculators, and this integration lets operators monitor how serve percentages deviate from historical norms within specific score states such as 30-15 or deuce. External validation comes from sources like the International Tennis Federation performance database, which supplies standardized point data across professional circuits for cross-checking algorithmic outputs.
Traders who deploy these logs during July 2026 grass-court swing observe distinct variance compression on faster surfaces compared with clay, where longer points amplify error variance and create wider confidence intervals around live odds. The approach scales across best-of-three and best-of-five formats because the underlying point sequences remain comparable once adjusted for match length expectations derived from prior seasons.
Market Applications and Observed Patterns
Live odds on next-point winner or game winner respond to isolated variance signals when models detect sustained deviations beyond two standard deviations from a player's established serve-hold rate, and exchanges adjust liquidity accordingly during these windows. Patterns emerge most clearly in matches between players with similar ranking profiles, where small point clusters determine whether a favorite maintains serve or concedes an early break that inflates underdog pricing temporarily.
Figures from multi-year match archives reveal that break-point variance accounts for roughly 18 percent of total point-level fluctuation in men's singles, a share that rises on return-heavy surfaces according to aggregated statistics compiled by regional tennis federations outside the primary circuits. Operators cross-reference these benchmarks with real-time feeds to flag when current match data diverges, enabling position sizing that accounts for the probability of reversion within the remaining games.
Integration With Broader Betting Ecosystems
Point-by-point systems interface with exchange APIs to stream updated probabilities, and this linkage allows variance-aware algorithms to place or hedge positions before wider market participants incorporate the same granular data. Regulatory reports from bodies such as the Australian Gambling Research Centre document how such data-driven approaches appear in professional trading desks, though retail access remains limited to those equipped with custom parsing tools.
July 2026 schedules highlight increased use of these methods during overlapping tournaments, where simultaneous matches generate high-frequency data streams that test the latency tolerances of variance models. Observers note that successful implementations maintain separate variance buffers for different court speeds and weather conditions, preventing overreaction to isolated points that fall within normal statistical ranges.
Conclusion
Point-by-point tracking supplies the resolution needed to isolate variance in live tennis markets by converting raw sequences into actionable probability adjustments, and continued refinement of these techniques depends on access to standardized data feeds and computational resources that process sequences faster than manual review allows. The patterns identified through this lens continue to inform how exchanges and traders manage exposure during matches where small clusters of points determine larger swings in market pricing.