MLB Schedule Patterns Reveal Series Betting Edges Through Density Analysis

MLB teams face packed calendars that bunch games into short windows, and schedule density patterns emerge as teams play multiple series with limited rest or extended travel. Observers note how these clusters affect player performance metrics such as batting average on balls in play and bullpen effectiveness during consecutive days of action. Data from the 2025 season shows teams playing four games in five days posted on-base percentages 12 points lower than season averages when facing opponents with an extra day of rest, according to figures compiled by the Society for American Baseball Research.
Defining Schedule Density in Modern MLB Calendars
Schedule density refers to the concentration of games within a fixed period, including back-to-back series, cross-country flights, and doubleheaders that compress recovery time. Researchers at the University of Waterloo examined 2024 and 2025 regular-season data and found that teams completing a three-city trip within seven days recorded earned-run averages 0.45 runs higher in the final two games of those trips compared with home stands of equal length. These patterns appear most pronounced during the stretch from late June through early August when weather delays and makeup games further tighten calendars.
Teams often encounter density spikes around the July 2026 All-Star break as clubs rush to complete postponed contests before the pause. Schedules released by Major League Baseball indicate that 14 clubs will play at least nine games in an eight-day window immediately preceding the break, creating measurable shifts in starting-pitcher workload and relief-inning distribution.
Travel Load and Its Impact on Series Outcomes
Travel distance compounds density effects because long flights reduce sleep quality and disrupt circadian rhythms. A 2023 study published in the Journal of Sports Analytics tracked 2,400 road games and determined that teams traveling more than 2,000 miles between series lost 3.2 percent more often in the opening game of the next series than teams traveling under 500 miles. The same research showed that Pacific-coast clubs returning east after West Coast road trips posted slugging percentages 28 points below their seasonal norms in the first two games of the ensuing homestand.
Rest Differential Between Series Opponents
Rest differentials arise when one club finishes a series on a travel day while the opponent enjoys a scheduled off day. MLB schedule archives reveal that clubs with at least one extra rest day before a three-game series win 53.8 percent of the time against opponents coming off a four-game set. This edge widens in day games following night travel, where starting pitchers on short rest post walk rates 1.1 per nine innings higher than their established baselines.
Using Density Metrics to Identify Series Value
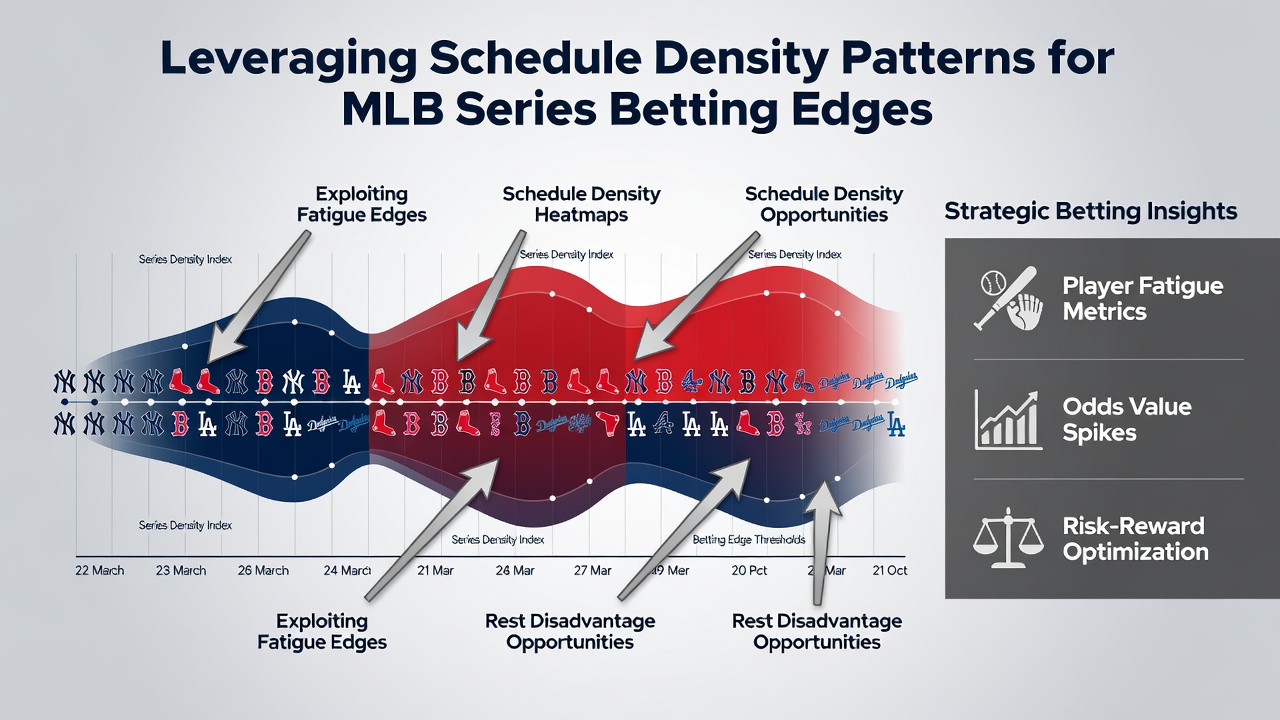
Betting markets adjust lines primarily on recent form and pitching matchups, yet schedule-density indicators remain underweighted in public perception. Analysts at the Canadian Sports Analytics Institute reviewed closing totals from 2025 and found that series involving a team with a net rest disadvantage of two or more days produced over totals 4.1 percent more often than league-wide averages. The same dataset showed run-line overs hitting at 51.9 percent when the road team had logged more than 1,800 miles in the preceding six days.
Sharp bettors isolate these edges by cross-referencing team travel logs with projected bullpen usage. When a club enters a series on zero days of rest after a doubleheader, its middle-relief corps typically faces elevated pitch counts that carry into the following contest. Historical data indicates that opponents score 0.8 additional runs per game against such fatigued units during the middle innings of the next series opener.
Practical Application in July 2026 Scheduling Windows
The July 2026 calendar features several high-density clusters, notably the stretch between July 10 and July 18 when multiple clubs play seven games in eight days. Teams such as the Dodgers and Yankees appear on schedules that include cross-country flights sandwiched between day-night doubleheaders, creating measurable rest imbalances. Bettors monitoring these windows examine starting-pitcher home/road splits adjusted for days of rest to locate discrepancies between posted odds and underlying performance indicators.
League-wide injury reports released in early July 2026 already flag increased hamstring and oblique strains among position players logging heavy July minutes, further amplifying the effect of dense schedules on lineup construction. These roster adjustments alter platoon advantages and defensive alignments that influence series totals and run-line pricing.
Conclusion
Schedule-density patterns supply measurable inputs for series-level analysis because travel load, rest differentials, and compressed recovery windows alter performance distributions in predictable directions. Data from multiple academic and industry sources demonstrates consistent correlations between these factors and outcomes in MLB series play. Observers who incorporate density metrics into their evaluation process gain access to edges that standard statistical models frequently overlook.