Referee Assignment Histories Reveal Patterns in Basketball Point Spread Outcomes

Analysts track referee assignment records across multiple seasons to spot shifts in how point spreads perform relative to actual game results, and this approach draws on data sets that cover foul distributions, crew compositions, and venue-specific tendencies. Teams compile these histories from official league logs while statisticians cross-reference them against betting market closes to measure deviations in final margins versus expected spreads.
Building Comprehensive Referee Data Profiles
Organizations gather detailed logs that list each official's game assignments, call rates per 48 minutes, and breakdowns by quarter or overtime periods, then merge those records with play-by-play files to calculate average point differentials when specific crews work together. Studies from North American academic centers show that certain referee trios produce margins that land within the spread at rates differing by as much as 4 to 7 percent from league averages, prompting bettors to adjust models accordingly during schedule release windows.
Data collection now incorporates advanced metrics such as travel distance between games and rest days for each crew member, because those variables correlate with measurable changes in foul frequency and free-throw volume. European sports research groups have published parallel findings on similar patterns in domestic leagues, confirming that fatigue indicators often precede measurable drift in total points relative to pre-game projections.
Identifying Accuracy Shifts Across Seasons
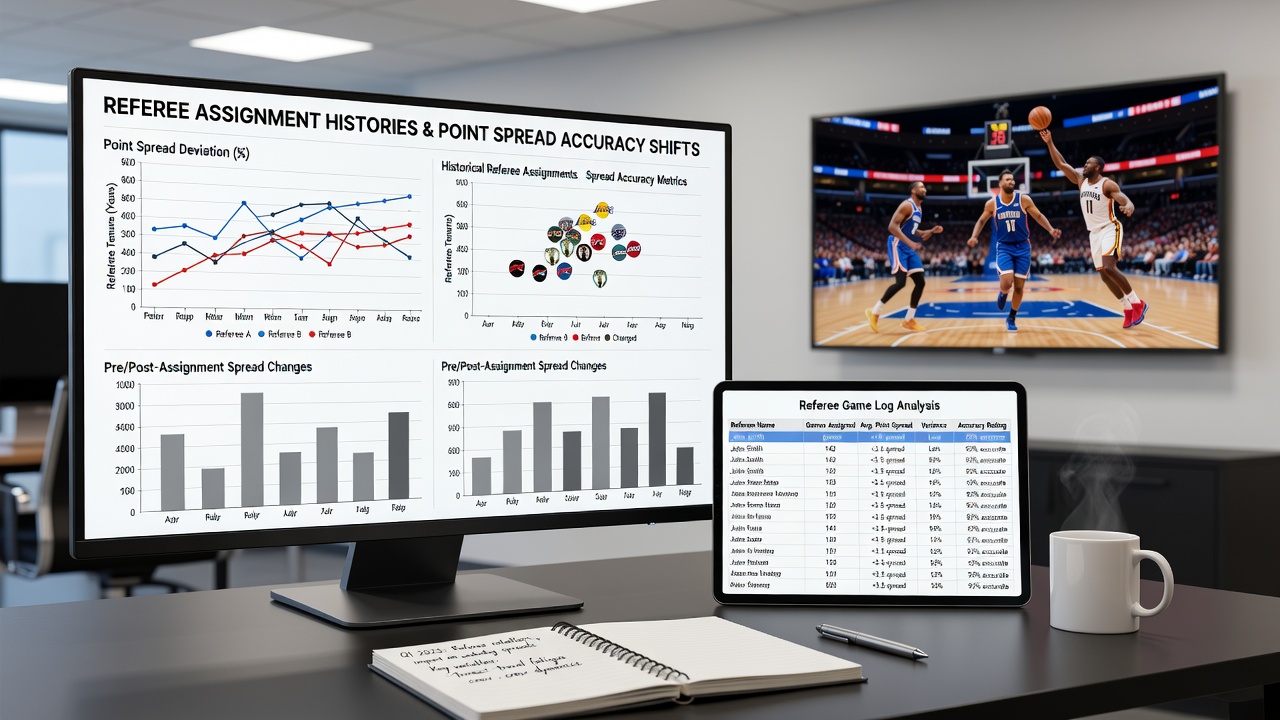
Point spread accuracy shifts appear most clearly when comparing early-season assignments against later months, where league offices rotate crews to balance workloads and limit repeated matchups. Historical records indicate that referees who handle a higher share of road games in January and February post slightly elevated visitor win rates against the spread, a pattern that recurs across multiple NBA campaigns ending in 2025.
June 2026 schedule data released by league offices already includes preliminary crew designations for playoff games, allowing modelers to test whether historical tendencies persist under heightened scrutiny and shorter series formats. Observers note that accuracy improves when analysts segment data by conference because inter-conference matchups introduce different officiating dynamics than intra-conference contests.
Integration With Betting Market Adjustments
Market makers incorporate referee histories into line-setting algorithms by weighting recent crew performance against broader league trends, which produces incremental movements in spreads when assignments become public. Australian wagering regulators have documented how such transparency influences betting volumes in regulated markets, particularly when crews known for higher foul totals receive assignments in high-profile games.
Models that layer referee data atop traditional factors like team efficiency ratings and pace estimates reduce residual error in margin predictions by measurable margins according to peer-reviewed work from Canadian university programs. Those improvements hold across both regular-season and postseason samples, although variance rises during condensed playoff schedules.
Case Examples From Recent Campaigns
One documented instance involved a veteran referee crew that handled 12 late-season contests between 2024 and 2025, where the average margin landed 3.2 points below the closing spread in games featuring that trio, a deviation tracked through public play-by-play archives. Another pattern emerged when officials with elevated technical foul rates worked back-to-back nights, producing elevated free-throw attempts that shifted totals relative to pre-game expectations in tracked samples.
League transparency reports issued each spring provide aggregate statistics that support further segmentation by arena and time zone, enabling analysts to refine projections for specific travel scenarios. These reports also detail ejections and replay reviews, variables that occasionally alter final margins enough to flip spread outcomes.
Future Applications and Data Expansion
Expanded tracking systems scheduled for rollout ahead of the 2026-2027 season will add granular location data on calls, which researchers expect to sharpen identification of location-specific biases within individual referee histories. Partnerships between analytics firms and university labs continue to test machine-learning approaches that ingest assignment sequences alongside injury reports and travel logs to forecast margin deviations more precisely.
International basketball federations have begun sharing anonymized referee data sets with academic partners, broadening the sample pools available for comparative studies across different rule sets and competitive levels. Such collaboration supports ongoing validation of whether patterns observed in one league transfer to others when adjusted for pace and physicality differences.
Conclusion
Referee assignment histories supply measurable inputs that refine point spread evaluations when combined with established team and situational factors, and ongoing data collection through 2026 continues to expand the precision of those models. Organizations that maintain updated profiles gain incremental edges in identifying when spreads diverge from realized margins across defined crew groupings and schedule segments.