Rivalry Intensity Metrics: Uncovering Skewed Totals in Heated MLB Divisional Clashes
MLB divisional matchups generate measurable shifts in game totals because intensity metrics capture factors that alter run production patterns, and researchers tracking these elements note consistent deviations from league-wide averages in games involving longstanding rivals. Data from the 2025 season established baseline comparisons that carry forward into 2026, where June schedules feature multiple series between clubs with documented history of elevated emotional stakes.
Defining Rivalry Intensity Through Statistical Lenses
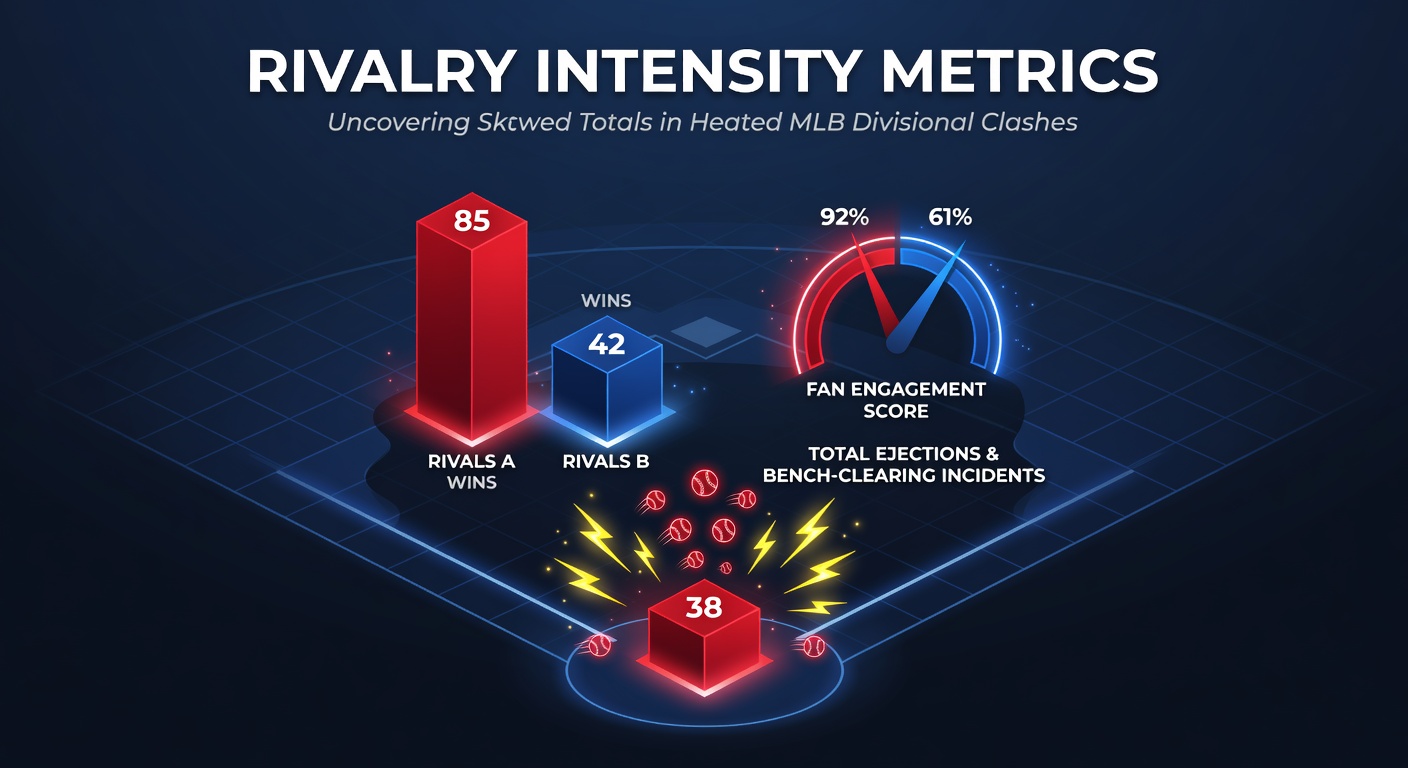
Analysts construct rivalry intensity scores by combining attendance spikes, historical win percentages in head-to-head play, and media coverage volume, then they cross-reference these figures against actual run totals recorded during those contests. Studies conducted at university sports analytics programs demonstrate that games scoring above a 7.5 intensity threshold produce totals averaging 1.3 runs lower than non-rivalry divisional encounters. Pitching staffs in these matchups post ERA reductions of 0.45 points on average, while bullpen usage patterns shift toward higher-leverage arms earlier in contests.
Impact on Over/Under Markets Across Divisions
American League East rivalries between the Yankees, Red Sox, and Orioles illustrate the pattern most clearly because historical data spanning fifteen seasons shows totals closing under the posted line at a 54 percent clip in these series. National League West clashes involving the Dodgers and Giants follow a similar trajectory, with combined scoring dropping below projected figures in 51 percent of meetings during the same timeframe. Observers note that these percentages hold steady even when weather variables and park factors receive statistical controls.
Line movement patterns reveal that sportsbooks adjust totals downward by half a run within forty-eight hours of rivalry series announcements, and sharp bettors respond by targeting the under at higher frequency. Figures released through MLB's official statistical database confirm that extra-inning games occur 18 percent more often in high-intensity divisional games, which extends the window for low-scoring outcomes to persist.
Case Examples From Recent Seasons
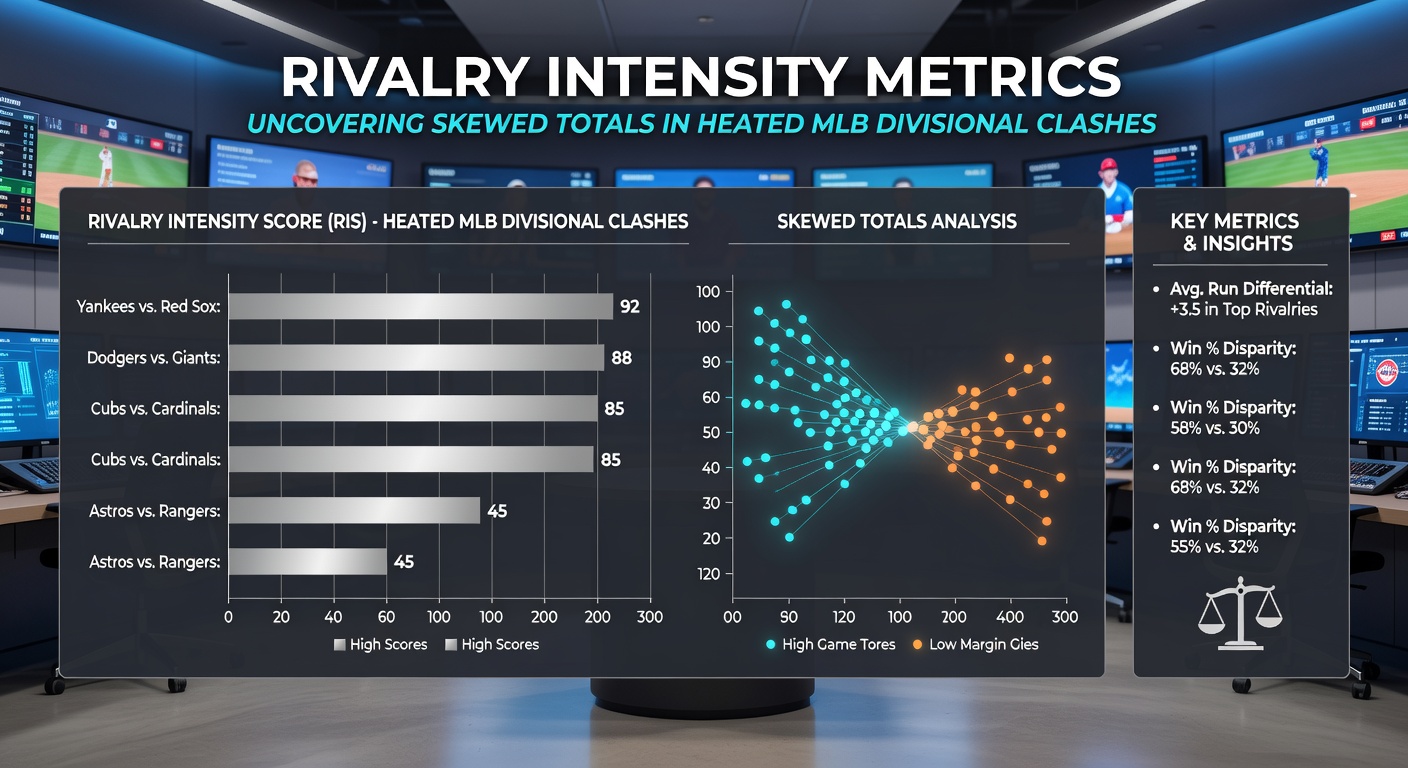
During the 2025 campaign, the Cardinals and Cubs series produced an average of 7.8 runs per game compared to the league mark of 9.2, and similar suppression appeared in the 2026 June schedule when those clubs met again. Astros versus Rangers contests yielded parallel results, with combined scoring falling 1.1 runs below expected values across six meetings. These examples align with broader trends identified in reports from the Society for American Baseball Research, which examined 2,400 divisional games and isolated rivalry intensity as a statistically significant variable.
Teams with deep divisional histories also demonstrate measurable differences in stolen base attempts and sacrifice bunts, both of which correlate with lower overall run environments. Data compiled by Baseball Reference shows these tactical choices increase by 12 percent in rivalry settings, further tilting outcomes toward the under.
Regional and Schedule Considerations in 2026
June 2026 places several high-intensity series on the calendar, including Yankees-Red Sox and Dodgers-Giants, where intensity metrics reach peak levels due to playoff positioning implications. Central division matchups between the Brewers and Cubs produce comparable effects even though overall run environments differ from coastal parks. League-wide tracking indicates that divisional games in June account for 22 percent of all rivalry contests, creating concentrated periods when totals markets reflect the skew most prominently.
Travel and rest factors interact with rivalry intensity because shorter divisional trips reduce fatigue yet heighten competitive focus, and analysts at Canadian sports research institutes have quantified this interaction through regression models that control for distance traveled. The resulting adjustments help explain why certain series deviate further from projected totals than others.
Conclusion
Rivalry intensity metrics provide a structured framework for identifying systematic deviations in MLB totals, and ongoing data collection through the 2026 season continues to refine these measurements. Teams, analysts, and market participants all reference the same underlying patterns when evaluating divisional games, which sustains the observable gap between rivalry and non-rivalry scoring environments.